All posts by Dustin Ryan

Dustin is a Data Platform Solutions Architect on the Education team at Microsoft. You can find Dustin blogging and speaking at events like SQL Saturday, Code Camp, and SQL Rally. Follow Dustin on Twitter @SQLDusty.

SSRS Expression Iif Statement Divide by Zero Error

If you’ve ever tried to use an IIF statement expression to fix an error received by dividing by zero, you probably still received the divide by zero error message. Very frustrating.

An expression like this returns an error when Sum(Fields!Beta.value) = 0:

=sum(Fields!Alpha.Value)/sum(Fields!beta.Value)

So you, being the critical thinker that you are, try the following:

=iif(sum(Fields!Beta.Value)=0,0,sum(Fields!Alpha.Value)/sum(Fields!Beta.Value))

Alas, this will not work. Even though SSRS may evaluate your expression as true, it still will attempt to resolve the false part of your expression, which gives you the divide by zero error.

To get around this infuriating issue Microsoft should have dealt with in the first place, try this:

=iif(sum(Fields!Beta.Value)=0,0,sum(Fields!Alpha.Value)/iif(sum(Fields!Beta.Value)=0,1,sum(Fields!Beta.Value))

This solution should fix any issues you have dividing by zero.

Setting Up a Macro in the BIDS Toolbar to Execute an SSIS Package

Here’s an extremely helpful little tip that my friend, Ken Hendrix, showed me the other day. Currently, to execute a single SSIS package in  BIDS, you have to open the Solution Explorer, right-click the package, and click Execute. If you’re debugging a lot or do not have your Solution Explorer open, this can sometimes be a little inconvenient. So Ken came up with a Macro that you can add to your tool bar that will allow you to execute your open package with a single click.

1. The first step is to create the Macro. With BIDS open, click View, select Other Windows, and Select Macro Explorer.
2. In the Macro Explorer, expand MyMacros and right-click on Module1. Select New Macro.

20110729 Execute Package Macro

3. Change the Macro Sub Name to ExecutePackage and add the Sub below:

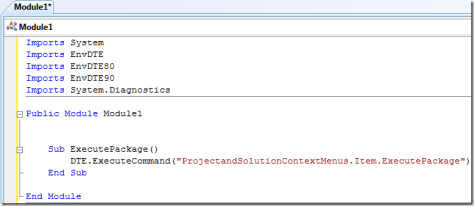
Sub ExecutePackage() DTE.ExecuteCommand("ProjectandSolutionContextMenus.Item.ExecutePackage") End Sub

Your macro should look like this:

Macro

4. Now we need to add the Macro to the toolbar in BIDS. At the end of the Standard toolbar, click the little drop down arrow, select Add or Remove Button. Then select Customize.

Add macro button

5. On the Commands tab of the Customize window, select Macros in the Categories pane. Find the Macro you created. It should read MyMacros.Module1.ExecutePackage if you gave it the same name as I did. Next, drag the Macro into the toolbar where you would like it to be.

Find MyMacro

6. With the Customize window still open, right-click the Macro in the toolbar, click Change Button Image, and select the icon you would like to display for your Macro. I selected the little running man. Lastly, right-click the Macro in the toolbar and click Default Style to remove the text next to the icon in the toolbar.

Change icon

And you’re finished! To execute an SSIS package with the new Macro, either highlight the package in the Solution Explorer or focus on the tab with the open package. Then click the icon to execute your Macro.

Macro toolbar Icon

I hope someone else finds this as helpful as I did. Thanks, Ken!

SSRS 2008 R2 LookUp and LookUpSet Functions

With the release of R2 came a couple of pretty nifty new expressions in SSRS. The LookUp function allows us to perform a look up against a separate data set in our report using a field in our source data set where there is a 1 to 1 relationship. Likewise, the LookUpSet function allows you to do a look up values in a separate data set where there is a 1 to many relationship.

The LookUp and LookUpSet functions are useful when you cannot write a query to join our two data sets together. So maybe we have a shared data source in our report that returns some data that we need to join to an embedded data set in our report. We could use the LookUp and/or LookUpSet functions to bring those two data sets together within our report.

Let’s walk through a couple examples so we can see how to use these new functions. First, lets check out the LookUp function. I’ve got a shared data set in my Report Project that returns the total Reseller sales but in my report I have an embedded data set that has all my Resellers names. I’ll use the LookUp function to bring those two data sets together.

Our expression to look up the TotalSales from our shared data set looks like this:

=LookUp(Fields!ResellerKey.Value,Fields!ResellerKey.Value,Fields!TotalSales.Value,"ResellerSales")

LookUp

Using the LookUp function, I’m able to look up the Total Sales Amount from the destination data set and bring it together with our source data set.

LookUp Report Preview

Now lets take a look at the LookUpSet function. At first glance, it appears to work exactly the same as the LookUp function.

=LookUpSet(Fields!CustomerKey.Value,Fields!CustomerKey.Value,Fields!OrderNumber.Value, "CustomerOrders")

But if we run our report with this expression, we’re going to get an error.

LookUpSet Report Preview with error

This is because the LookUpSet function brings back a collection of results. We cannot simply display the results in a textbox in our tablix. We need to concatenate the results into a string. To do this, we are going to use the Join function with our LookUpSet function.

=Join(LookUpSet(Fields!CustomerKey.Value,Fields!CustomerKey.Value,Fields!OrderNumber.Value, "CustomerOrders"),"," + vbcrlf)

The Join function takes a collection of objects and delimits them with our specified delimiter. In this case, our delimiter is a comma with the VB carriage return line feed (vbcrlf). Using the Join and LookUpSet functions, we are able to look up all the order numbers from the destination data set and bring those into the same tablix as our source data set.

LookUpSet Report Preview

Pretty cool, huh?

Use Date Picker Control with MDX Based Reports

If you’ve done a couple cube based reports, you’ve run into the issue of the dates being in string format. Because the dates are strings inside your cube, you can’t use the neat little date picker control reporting services gives you for datetime parameters. While you as a developer may understand this issue, your "tech savvy" end users may not. Fret no more. Here is a quick and easy way to use the built in date picker control for parameters in your MDX reports.

1) In the Report Data pane of BIDS, open the parameter properties for the parameter(s) you are using to specify a date or begin and end dates and change the data type to datetime. Change available values to None.

2) Go ahead and delete any hidden datasets that populate the drop down lists for your date parameters. You won’t need those with the date picker control.

3) In your data set that populates your report, open the properties, and in the parameters view, you want to use an expression on the parameter value field. So instead of the parameter value containing something like "=Parameters!DateDate.Value", you want to change it to something like:

="[Date].[Date].&[" + Format((Parameters!DateDate.Value), "MM-dd-yyyy") + "]"

Keep in mind that you’ll need to perform step 3 on any data sets that use your date parameters.

The key is to format the expression in such a way that it looks exactly like the members of your date dimension. Once you do that, click preview and you have the beautiful and end-user friendly date pickers in your cube based reports!

You can also go back to your parameters to specify default values using today and/or dateadd (ex. "=dateadd("M",-12,today)").

One of the downsides to using the date picker control with reports using your cube is a data source is that if the end user selects a date in the date picker that is not in your cube, your report is going to blow up, so just be aware of that.

If you have any questions, feel free to leave a comment!

SSIS Package Development Troubleshooting Tips

When developing an SSIS package, sometimes it can be frustrating trying to troubleshoot various issues and faults with the package. And if you’re not a seasoned SSIS developer, you may not be sure about the best way to solve your problem. Thankfully, Microsoft has seen fit to bless us with some useful tools for troubleshooting.

Control Flow Troubleshooting

When working in the Control Flow, there are several useful ways to troubleshoot during the development of your SSIS Package:

1) Use breakpoints! Breakpoints can be applied to an individual task or at the package level. A break point will pause the execution of the package at a certain point. You can specify a package to pause at pre-execution, post-execution, on warning, or on error event of a single task, container or package, just to name a few. To enable a breakpoint, right click the task you want to enable your breakpoint on and select Edit Breakpoints. You’ll then be able to specify on which event you would like to pause the package. After adding a breakpoint to a task, you will see a red dot on the task. During execution of the task, you will see the red dot change. To continue execution of a package after it has paused at a breakpoint, simply click the green “Play” button.

SSIS Package Troubleshooting Tips - Edit Breakpoints

2) Check the progress tab! The Progress tab displays valuable information about the execution of your SSIS package. In the Progress tab, SSIS will list all tasks in order of execution and display start and finish times at the task and package level. It even contains message about any errors or warnings that may have occured during execution. If your package failed, this is where the error will be displayed!

3) Use the Debug Windows! The various Debug windows provide you with valuable information during the execution of a package that has breakpoints. Error messages and warning are displayed in the Debug Output window, as well as value of variables during execution. To view the various Debug windows, add a breakpoint at the Pre-Execute event of the package and execute the package. Then in the main menu at the top, click Debug, select Windows, and you will be able to select the various debugging windows. To view the values of variables during run time, open the Watch window and type in the name of the variable you’d like to watch. The watch window will then display the data type and value of any variable you’d like to see.

SSIS Debug Windows

Data Flow Troubleshooting

Troubleshooting the execution of a Data Flow Task is a little different than troubleshooting the Control Flow because you cannot add a breakpoint to a Data Flow Transform. But there are still tools available to us as developers.

1) Use Data Viewers! Data viewers allow us to watch the data as it passes between transforms. A data viewer can display data in a grid, histogram, scatter plot, or column chart format. To add a data viewer to a Data Flow, simply right click a precedence constraint and select Data Viewers. You can then Add and Delete a data viewer.

Data Viewer

2) Use a Conditional Split as a destination! This is kind of a little trick that SSIS developers use that allow you to execute a data flow without writing to a destination. Simply use a Conditional Splitl as the last transform in place of a destination in the data flow and place a data viewer on the precedence constraint directly before the Conditional Split. You can then copy and paste the data from the data viewer into Excel or Note Pad for further review. Or if your place of employment has blessed you by purchasing Task Factory, simply use the Terminator Destination, which requires no configuration and acts as a dead end for your Data Flow during development.

Terminator Destination

3) Use Row Count transforms! Placing a Row Count directly after the source and directly before the destination in a data flow will allow you to closely monitor the number of rows passing through your data flow.

4) And lastly, use the Progress Tab and Debugging Window just like when you are troubleshoot your Control Flow.

Even while using each and every last one of these tips I’ve covered, every once in a while you’re going to come across on error that offers no real explanation or solution. Which brings me to my final and most important tip to remember when trouble shooting your SSIS package: GOOGLE! Laughing

SSAS 2008 Storage Modes

In SQL Server Analysis Services 2008, we have three storage mode options available to us: Relational Online Analytical Processing (ROLAP), Multidimensional Online Analytical Processing (MOLAP) and Hybrid Online Analytical Processing (HOLAP). There are advantages and disadvantages to each, so I figured I’d take a few minutes to give a quick overview describing the storage modes and laying out some of the pros and cons of each.

Relational Online Analytical Processing (ROLAP)

The ROLAP storage mode allows the detail data and aggregations to be stored in the relational database. If you plan on using ROLAP, you need to make sure that your database is carefully designed or you’ll run into some bad performance issues.

Pros:

  • Since the data is kept in the relational database instead of on the OLAP server, you can view the data in almost real time.
  • Also, since the data is kept in the relational database, it allows for much larger amounts of data, which can mean better scalability.
  • Low latency.

Cons:

  • With all the data being stored in the relational database, query performance is going to be much slower than MOLAP.
  • You must maintain a permanent connection with the relational database to use ROLAP.

Multidimensional Online Analytical Processing (MOLAP)

MOLAP is the default and thus most frequently used storage mode. With MOLAP storage, the data and aggregations are stored in a multidimensional format, compressed and optimized for performance. This is both good and bad. When a cube with MOLAP storage is processed, the data is pulled from the relational database, the aggregations are performed, and the data is stored in the AS database.

Pros:

  • Since the data is stored on the OLAP server in optimized format, queries (even complex calculations) are faster than ROLAP.
  • The data is compressed so it takes up less space.
  • And because the data is stored on the OLAP server, you don’t need to keep the connection to the relational database.
  • Cube browsing is fastest using MOLAP.

Cons:

  • Because you don’t have a real time connection to the relational database, you need to frequently process the cube to update your data.
  • If there’s a large amount of data, processing is going to take longer.
  • There’s also an additional amount of storage since a copy of the relational database is kept on the OLAP server.
  • High latency.

Hybrid Online Analytical Processing (HOLAP)

HOLAP is a combination of MOLAP and ROLAP. HOLAP stores the detail data in the relational database but stores the aggregations in multidimensional format. Because of this, the aggregations will need to be processed when changes are occur. With HOLAP you kind of have medium query performance: not as slow as ROLAP, but not as fast as MOLAP. If, however, you were only querying aggregated data or using a cached query, query performance would be similar to MOLAP. But when you need to get that detail data, performance is closer to ROLAP.

Pros:

  • HOLAP is best used when large amounts of aggregations are queried often with little detail data, offering high performance and lower storage requirements.
  • Cubes are smaller than MOLAP since the detail data is kept in the relational database.
  • Processing time is less than MOLAP since only aggregations are stored in multidimensional format.
  • Low latency since processing takes place when changes occur and detail data is kept in the relational database.

Cons:

  • Query performance can head downhill fast when more detail data is queried from the relational database.

This is by no means an exhaustive list of the details in regards to each storage mode, but I hope this has given you a good general understanding of the differences between ROLAP, MOLAP, and HOLAP. Feel free to post any comments or questions. Thanks, guys!

Check IsNumeric() with Derived Column Transform in SSIS Package

At some point or another, you’ve probably run into the road block that is the lack of an ISNUMERIC() equivalent within the SSIS expression language. While you can’t use ISNUMERIC() in an SSIS transform, such as a Conditional Split Transform or a Derived Column Transform, that doesn’t mean you can’t check to see if a field is numeric using the SSIS expression language (If you feel so inclined, you can use a Script Task to check if a field is numeric. Tim Murphy, another Pragmatic Works consultant, covers that in his blog here).

As I said before, there is a way we can use a Derived Column Transform (or Conditional Split) to check if a field is numeric. After dragging in a Derived Column Transform into your Data Flow Task, create a new column to be added as a new column to your data flow. Give it a meaningful name and use this expression:

(DT_I4)CheckForNumeric == (DT_I4)CheckForNumeric ? 1 : 0

check for numeric with derived column

Then near the bottom of the Derived Column Transform Editor window, click Configure Error Output. You need to tell SSIS to Ignore failure on Error, as seen here:

Ignore failure

Optionally, you could choose to redirect rows that are not numeric to the Error output of the Derived Column and then handle those rows there.

Now when we run the Data Flow Task, we should see results like this:

IsNumeric results with Derived Column

You can see that the rows that are not numeric have a NULL value for the IsNumeric field we created with the Derived Column. Rows that are numeric have a 1. This way it is easy for us to determine which rows of a certain field are numeric and which are not numeric by checking for NULLs in our field called IsNumeric.

Creating Stepped Reports with SSRS

One of the nice things about a stepped report is that the child groups are displayed beneath the parent groups but within the same column as the parent group. In the next several steps, I’m going to walk through creating a basic stepped report using the Tablix data region. I used the Matrix data region template for this example.

First I created a report and dragged in a Matrix data region into the design area. I used the Adventure Works Cube and a simple data set with the Product hierarchy, Reseller Sales Amount and Calendar Year. Here is the query I used for the main dataset in case you would like to follow along.

SELECT NON EMPTY { [Measures].[Reseller Sales Amount] } ON COLUMNS, NON EMPTY { ([Product].[Product Categories].[Product].ALLMEMBERS * [Date].[Calendar].[Date].ALLMEMBERS ) } DIMENSION PROPERTIES MEMBER_CAPTION, MEMBER_UNIQUE_NAME ON ROWS FROM [Adventure Works] CELL PROPERTIES VALUE, BACK_COLOR, FORE_COLOR, FORMATTED_VALUE, FORMAT_STRING, FONT_NAME, FONT_SIZE, FONT_FLAGS

I put Product in the row group, Calendar Year on the column group, and Reseller Sales Amount in the details.

Capture1

Next we need to create a parent group for to display our Subcategory. To create a parent group, in the Row Groups pane, right-click the Product group, select Add Group, then select Parent Group.

Capture2

Select Subcategory as the field you want to group by. Make sure to check the Add group header check box.

Capture3

After creating the new group for Subcategory, right-click the Subcategory group in the Row Groups pane, and create a new parent group for the Category field. Again, check the box next to Add group header.

At this point, you matrix should look like this.

SSRS Stepped report layout

But since we are creating a stepped style report, we want our parent groups in the same column as our detail group. So we can delete the columns that contain Category and Subcategory.

Customize your SSRS stepped report layout

Then add Category and Subcategory to the rows above Product so that your Matrix looks like what you see below. Also, don’t forget to add Reseller Sales Amount in the cells next to Category and Subcategory.

Consolidate the groups in your SSRS stepped report

Now we’re almost done. To create the stepped formatting, right-click the cell containing Subcategory and select Text Box properties. In the Alignment pane under Padding options, set the Left padding to 15pt. Then click OK.

Create dynamic padding for your SSRS stepped report

Then right-click the cell containing the Product field and click Text Box properties. This time in the Alignment pane, set the Left Padding to 30pt.

Modify the SSRS stepped report group properties

The last thing we have to do is create that nice, fancy, collapsible drill-down action. To do that, right click the Product row group in the Row Groups pane and navigate to the Visibility pane. When the report is initially run, we want the Product row group set to Hide. Check the check box next to Display can be toggled by this report item. Since we want the Product row group to be toggled by its parent group, select the Subcategory text box in the drop down list.

Modify the SSRS stepped report group properties

We also should set the visibility settings of the Subcategory row group so that it is also hid when the report is initially run. It should be toggled by the Category row group.

And after adding some nifty back ground colors to make our report a little easier to read and some bold text on the header row, you are done! We now have a simple, yet easy to read, stepped report that will allow the end user to drill down into the child group rows to view the data at a more granular level.

The final Reporting Services SSRS stepped report example

Recording Available for Reporting on a Cube with SSRS 2008 Webinar

Thanks to all of the attendees that showed up for my webinar yesterday. I had a great time speaking and I hope everyone enjoyed the webinar and maybe even learned something.

If you missed the webinar, Reporting on a Cube with SSRS 2008, have no fear! There is a recording available for you to watch. Just head over to the Pragmatic Works CMS site and create a free account. Not only will you be able to watch my webinar from yesterday, you’ll also be able to check out tons of other great webinars from some really sharp speakers. So head over to the Pragmatic Works CMS site, create a free account, and watch my webinar here.